The JPL Dashboard serves as a comprehensive overview of the operational and logistical metrics across multiple key segments of the plant. Designed to provide actionable insights at a glance, the dashboard is segmented into five distinct cards, each tailored to a critical area of operations: PLANT, ASH, GARE PALMA IV/1, GARE PALMA IV/2-3, and CHPO.
Each card highlights essential metrics and performance indicators:
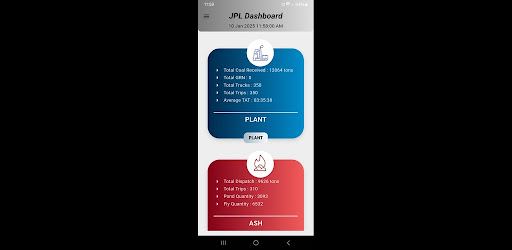
PLANT:
Total Coal Received: The cumulative quantity of coal received by the plant.
Total GRN: The number of Goods Receipt Notes generated.
Total Trucks: Count of trucks utilized in operations.
Total Trips: Number of trips completed.
Avg TAT (Turnaround Time): The average time taken per truck from entry to exit.
ASH:
Total Dispatch: Quantity of ash dispatched to various destinations.
Total Trips: Number of trips completed for ash transportation.
Pond Quantity: The current quantity of ash in ponds.
Fly Quantity: The amount of fly ash generated or stored.
GARE PALMA IV/1:
Coal Dispatch: Total quantity of coal dispatched from this location.
Coal Excavated: The amount of coal extracted from this site.
OB Removed: Overburden removed during mining.
Ash Received: Ash quantity received at this location.
Trips: Total trips associated with this site.
GARE PALMA IV/2-3:
Coal Dispatch: Coal dispatched from this mining area.
Coal Excavated: Total coal excavated from this region.
OB Removed: Overburden management during operations.
Ash Received: Amount of ash received here.
Trips: Operational trips for logistics and dispatch.
CHPO (Central Handling and Processing Office):
Total Coal Received: Aggregate coal received at this location.
Total GRN Done: Number of Goods Receipt Notes processed.
Total Trucks: Count of vehicles engaged in transportation.
Received from IV/1 and IV/2-3: Quantities received from the respective locations.
The dashboard's intuitive design enables stakeholders to quickly evaluate performance, monitor key metrics, and identify areas for operational improvement. Whether it’s managing coal logistics, tracking ash dispatch, or overseeing mining outputs, the JPL Dashboard ensures that critical information is readily available. This real-time visibility aids in optimizing workflows, enhancing productivity, and maintaining efficiency across all facets of plant operations