We are excited to introduce Just Ticks Android App Version 2.0, now available on the Google Play Console. This update brings numerous enhancements and new features to improve your options trading experience. Let's explore what's new:
Features:
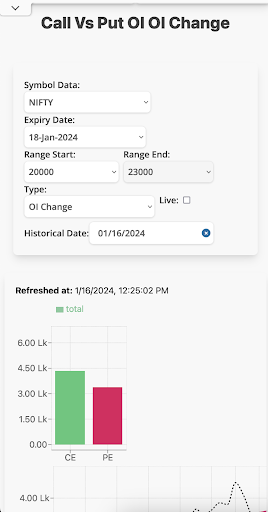
Call Vs Put OI
Analyze Call Vs Put Open Interest (OI) charts for selected expiry dates.
Gain insights into NSE and BSE Indices like NIFTY, BANKNIFTY, FINNIFTY, SENSEX, and BANKEX.
Trending OI
Explore real-time open interest data for popular indices such as NIFTY, BANKNIFTY, FINNIFTY, SENSEX, and BANKEX.
Monitor overall OI, changes in OI, and trading volumes.
Strangle Price and Straddle Price
Discover call and put strike prices for indices like NIFTY, BANKNIFTY, FINNIFTY, SENSEX, and BANKEX.
Access live and historical data for precise options trading.
Multi Straddle Price
Find multi-straddle prices for NIFTY, BANKNIFTY, FINNIFTY, SENSEX, and BANKEX options.
Select expiry dates and strike prices for real-time or historical data.
Spread Price
Analyze call and put spread strike prices for NIFTY, BANKNIFTY, FINNIFTY, SENSEX, and BANKEX options.
Gain insights into spread option strategies with live and historical data.
OI Analysis
Explore Open Interest (OI) Analysis for NIFTY, BANKNIFTY, FINNIFTY, SENSEX, and BANKEX.
Discover live OI changes, historical data, and more for informed options trading decisions.
Price vs OI Analysis
View Price vs Open Interest charts for instruments like NIFTY, BANKNIFTY, FINNIFTY, SENSEX, BANKEX, and NSE stocks.
Analyze the relationship between price movements and open interest for better trading decisions.
Implied Volatility Analysis
Gain insights into implied volatility for NIFTY, BANKNIFTY, and FINNIFTY options trading.
Access historical data and live updates for smarter trading strategies.
Future Trend Analysis
Monitor the latest future trends and Open Interest changes for NSE symbols, including both indices and stocks.
Future Analysis
Access the latest data on stock futures, including price changes, percentage shifts, open interest, and more.
Analyze trends for different expiry dates and symbols.
Index Heatmap
Get an overview of various indices and select your preferred index to view live or static heatmaps.
Index Pullers & Draggers
Access tables containing pullers and draggers stocks for various indices.
Choose your preferred index to display live or static pullers and draggers stocks.
Stock OI Analysis
Dive into Open Interest data for stocks.
Choose a stock symbol, select an expiry date, and access information on Open Interest, Change in Open Interest, and Total Traded Volume in both live and historical modes.
Market Screener
Analyze market actions with our screener.
Filter stocks based on intervals, pattern groups, sub-patterns, and specific patterns.
Combined Pattern Screener
Group trading patterns by symbols and datetime.
Explore the convergence of multiple patterns for precise breakout opportunities.
Daily Volume Screener
Identify potential investment opportunities with the Daily Volume Screener.
Analyze daily trading volumes, including delivery volume, comparison volume, and various multipliers.
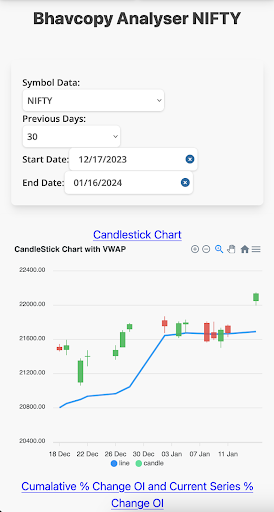
FO Bhavcopy Analyser
Enhance your trading strategy with FO Bhavcopy Analyser.
Gain insights into open interest, volume, and relative strength.
Access cumulative open interest (OI), cumulative change in open interest (ChOI), and series volume-weighted average price (VWAP) analyses.
Synthetic Future Analyser
Elevate your trading strategy with Synthetic Future Analyser.
Gain insights into synthetic future prices, spot prices, and future prices.
Future Long Short Analysis
View a table displaying Long Buildup, Short Covering, Long Unwinding, and Short Buildup trends for various future stocks.
Analyze future long-short trends over time.