All the gas pipelines of the TGN system are represented graphically and with 3D visualization, at the same time other elements such as milestones, blocking valves, protection tiles can be located.
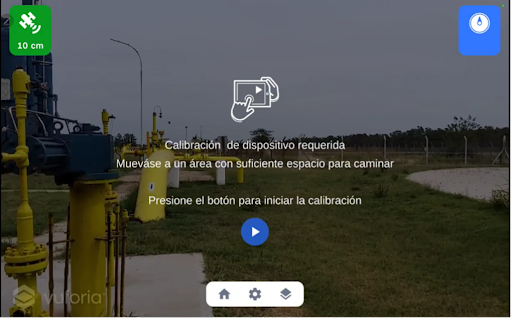
When starting the app, the section to be analyzed must be searched and downloaded, after which the calibration of the equipment will be needed, this calibration consists of reducing the geo-positioning error and achieving an error in cm in relation to reality in the field .
Once the app is calibrated, the main elements begin to be visualized in 3D, initially the trace is shown, the milestones and, depending on the location, the blocking valves, derivations, protection tiles, fiber optic crossings and electro ducts will be added, each one with its corresponding attribute information.